Innovative and feature-rich will solve
the problem of site management
Number introduced 1,000,000 Break through the site
Found improvements in innovative eight of the heat map analysis.
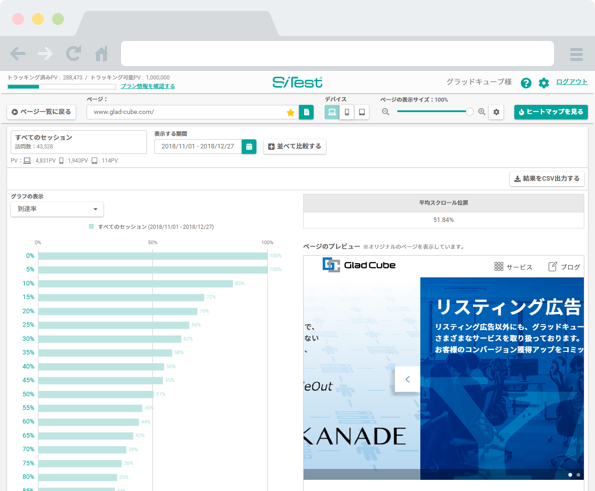
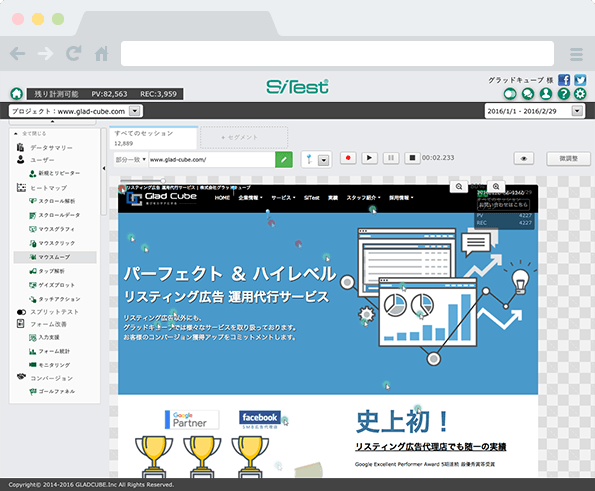
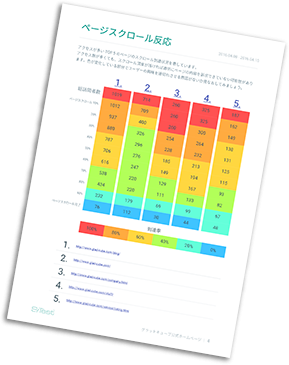
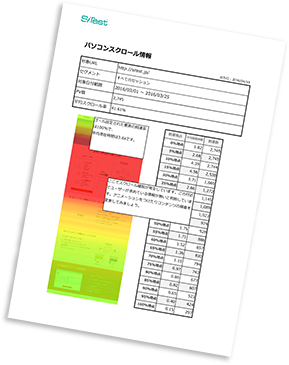
Scroll analysis
If the user has to scroll to any part of the page is the ability to display a heat map format.
Red residence time is longer place, closer to the blue shorter.
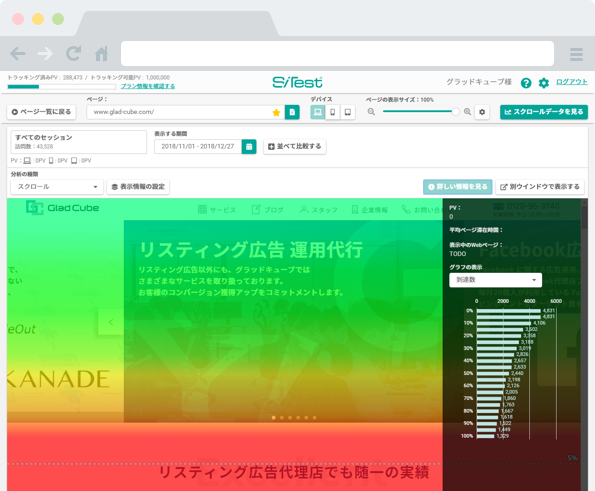
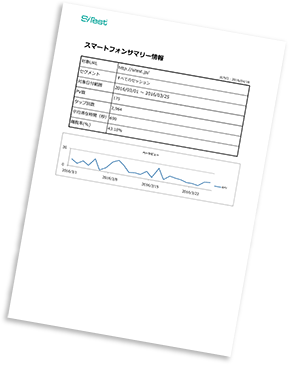
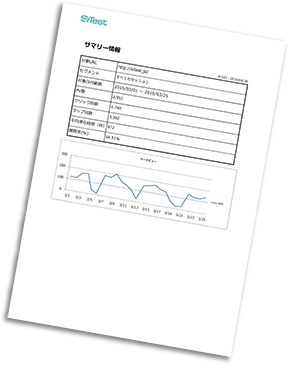
Scroll data
The data to be displayed as a heat map in the scroll analysis is the ability to quantitatively display.
You can analyze the arrival visits and the average viewing time of web pages each point in the display format graph.
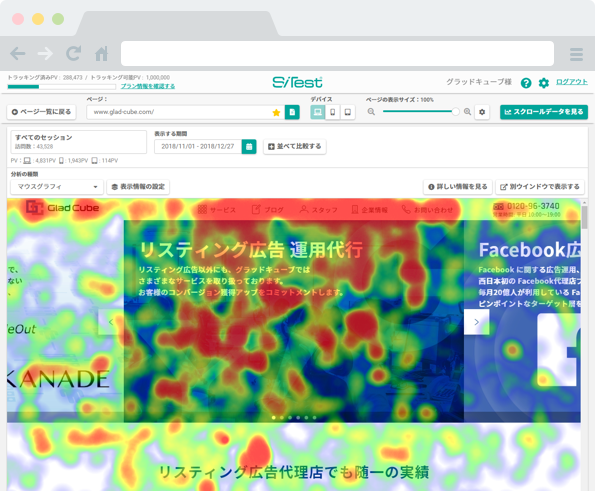
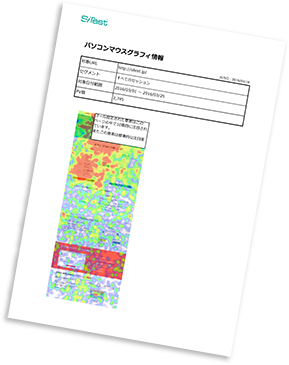
Mouse graphics
The stay location of the user's mouse pointer is the ability to display as thermography.
Residence time of the mouse pointer will be displayed in red as long point.
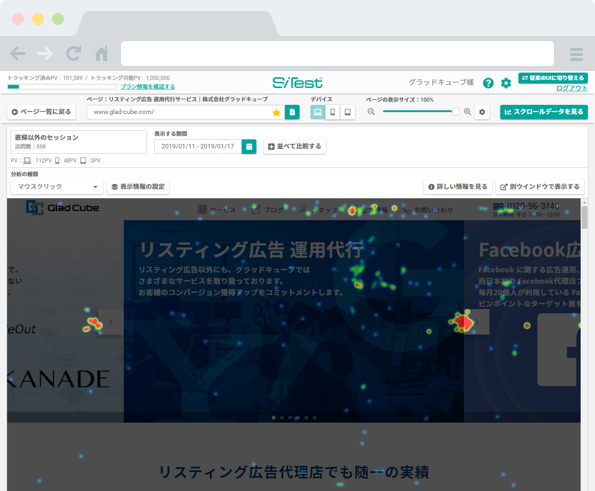
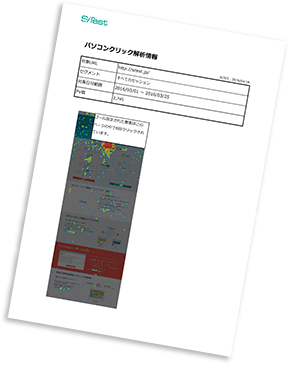
Click analysis
This function is used to display the location where the user has clicked on the page.
You will be able to use in determining whether they are clicking as expected.
Mouse move
To record a user's movement on the page, it is to play.
It is possible to simultaneously play the movement of multiple users.
The movement of the user's entire mice bird's-eye view will also be recording and playback.
Gaze plot
A number the order in which the user moves the mouse, is the ability to display the stay time of the mouse pointer in a circle of size and color.
By reading the causal relationship of the order, it helps to reconsider the elements and the order in which you configure the page.
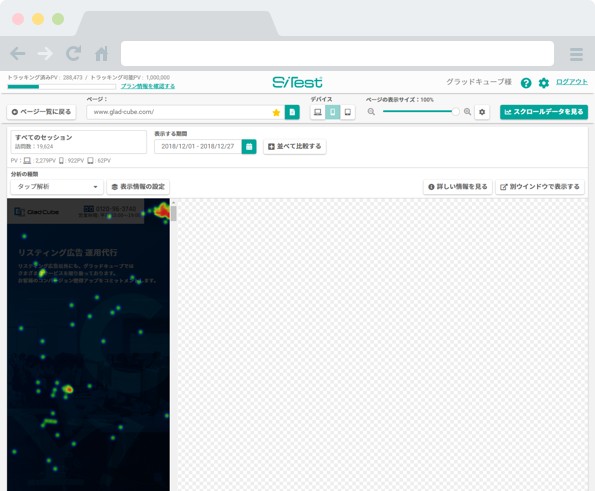
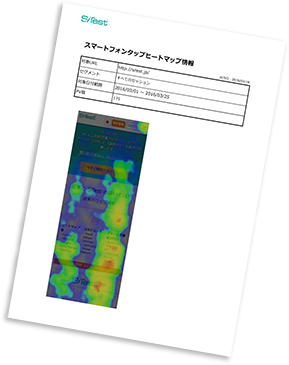
Tap analysis
It displays the location where user taps in the smartphone and tablet devices.
For many also different cases is the user's movement in the PC, please be divided into analysis.
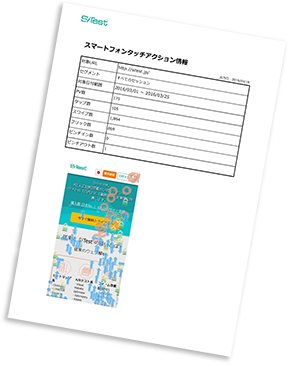
Touch action analysis
Smartphone and the user taps that occur on the tablet, swipe, flick, pinch, you can see the trend in whole or in segments of the pinch-out.
It is seen in touch action analysis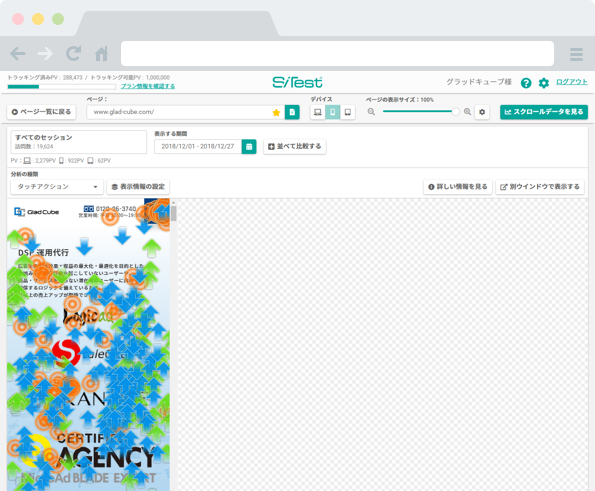
Machine learning and behavior data of the vast web site
AI (artificial intelligence) report
To take advantage of the neural network, learning the web behavior data of SiTest introduction site, to analyze the improvements from the situation of the situation and the other site of your site in a new point of view.In addition, it can help us to the improvement of the ad because it is easy to understand reporting with conversion data are a variety of cuts of the site.
Benefits of the AI report


Time is not necessary at all to be applied to the heat map analysis!
Smart report
It can be exported in the state in which various heat map analysis results were summarized in an Excel file.
Further advice comments by artificial intelligence comes with.
Because the Excel file, it can also be processed easier consultants.
You can also easily available as a value-added to our customers.

AI (artificial intelligence) automatic optimization in A/B test
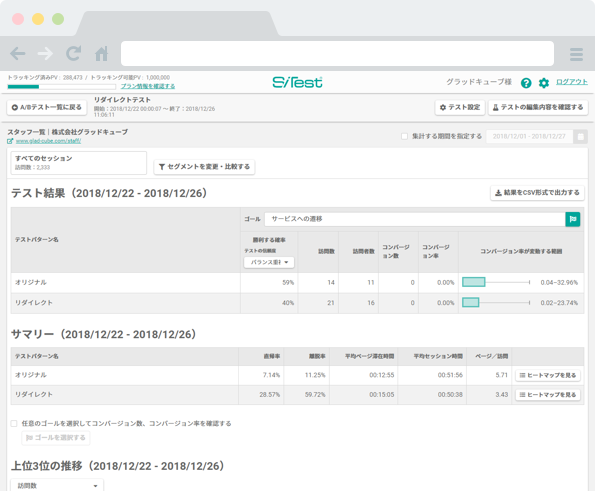
A/B test
You can create test pages quickly and easily even for web novices.
In addition to text, you can set the color of the button or change the position of elements in just three steps, and start testing right away.
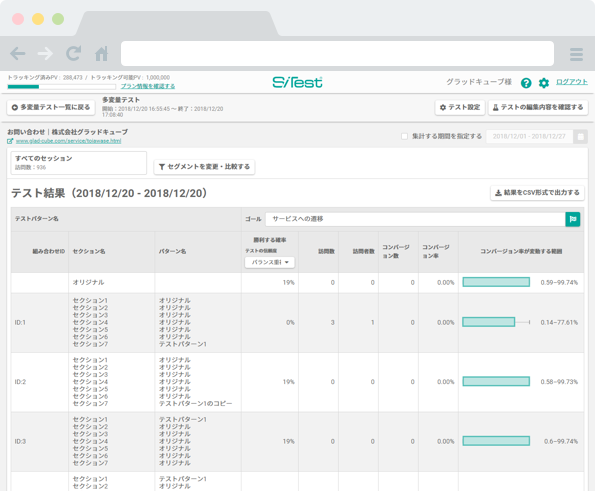
Multivariate test
In A/B testing, you can only test one element, but multivariate testing allows you to test multiple elements at once.
If you have a lot of connections from users, please use multivariate tests that can improve your site faster.
AI (Artificial Intelligence) automated testing
Based on the know-how of Gladcube, which is performing in web marketing, which is strictly demanding for the automatic optimization of SiTest + Artificial intelligence automatically suggests improvement of web page based on user's behavior data of your website · A / B is an innovative feature that performs test runs.
What you can see in the AI automated test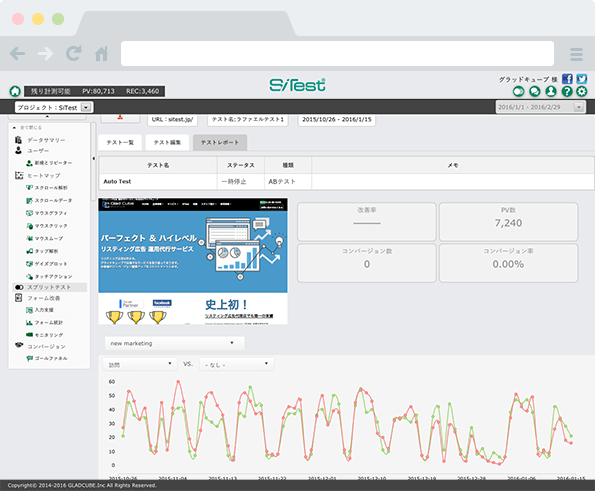
Flexible LPO
A screen pattern is created in the same manner as the A / B test, and a screen pattern is created based on conditions such as reference source, new, repeat, region (city, city, county), time zone, day of week, browser, This is a function that can control the pattern. You can optimize the visible landing page for a specific target.
What you can see with flexible LPO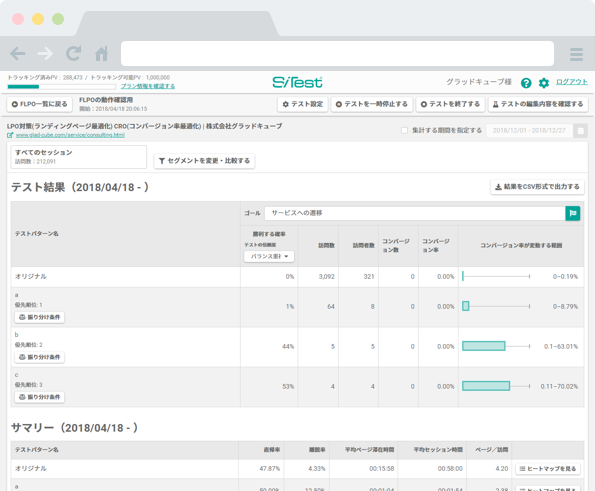
Sales if Seisure the EFO measures go up to ensure
Input support function
This function displays an error at the moment when the user makes an input mistake in the form.
Help reduce bounce rates in forms and improve contract rates.

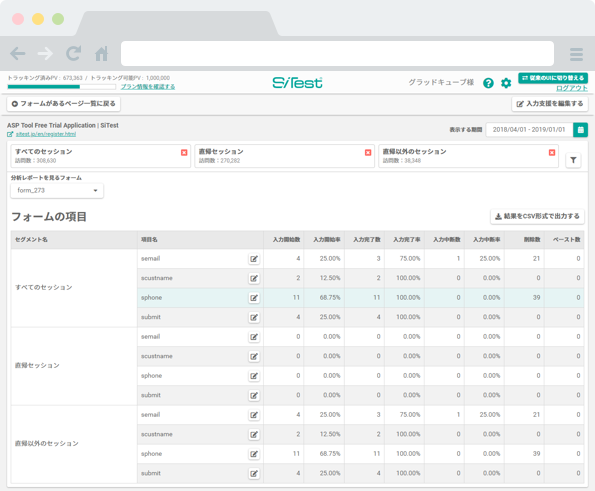
Form statistics
Forms statistics show statistical data about the input status of the forms installed on your site.
Because you can check the input start rate, the interruption rate, and the completion rate for each item in an easy-to-understand graph, you can find items that are easily removed.
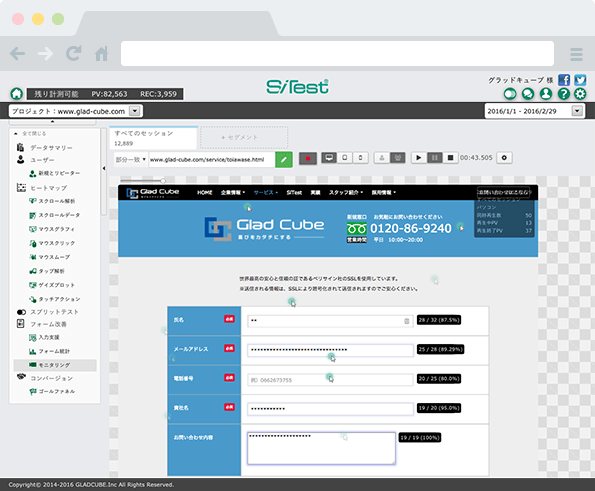
Monitoring
Monitoring allows you to record and play back how users are typing in a form, which helps you analyze where the problem is on the form.
We do not collect personal information, so please rest assured.
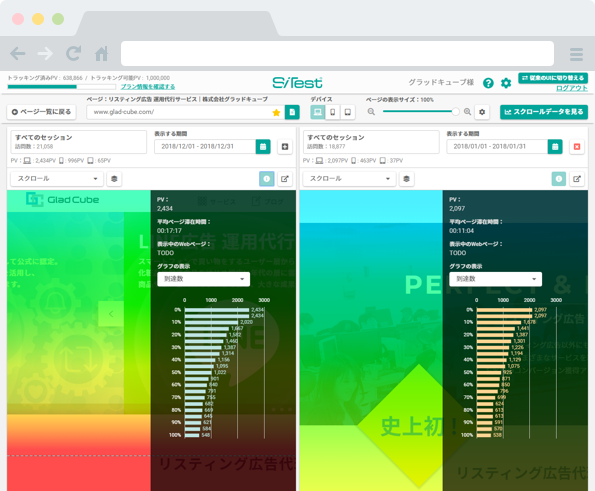
The world's first comparative analysis shows improvement
Period comparison function
Whether the result of improvement of the website improves is not solved by only the heat map interpretation at the present time.
SiTest is able to judge the achievement of improvement by comparing it with before and after installing the innovative function comparing with period which had never been seen before.
(Patent pending / Application No.: Special 2014-157019)
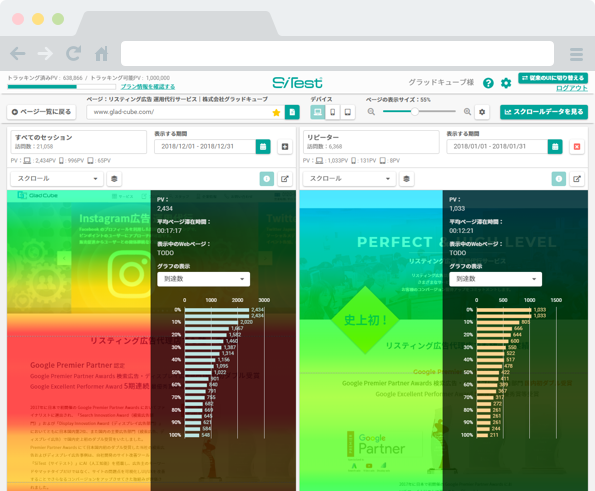
Segment comparison function
Users who visited the website, the users who were not there soon, and the users who did not go out of the way.
Segment comparison function divides user information according to specific conditions and displays difference of viewpoint and viewing flow.
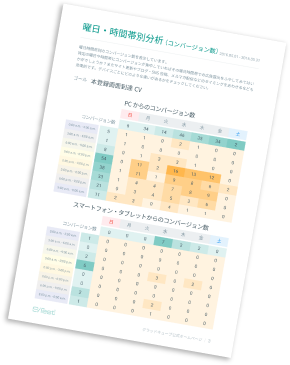
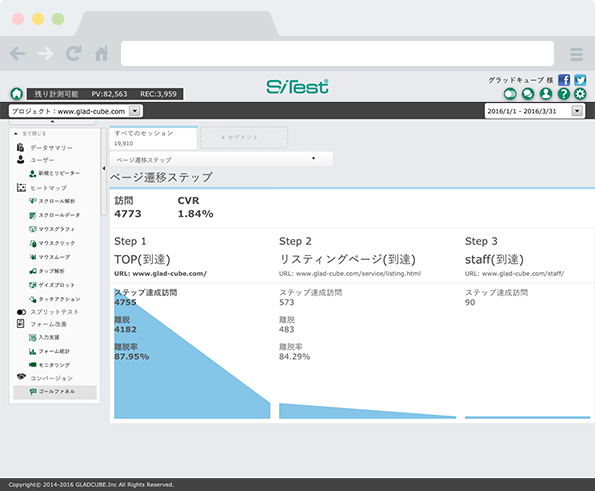
Specify the bottleneck section with conversion analysis
Goal Funnel
SiTest goals can be set up in multiple steps.
The number of achievements for each step can be examined by the Golfenel. By taking the user who achieved the first step, you can analyze how much the user is leaving until the last step.
You can see not only the transition of the URL but also the reduction of each person who clicked the mouse on the banner image, who clicked it.
Also standard equipment quantitative numerical analysis
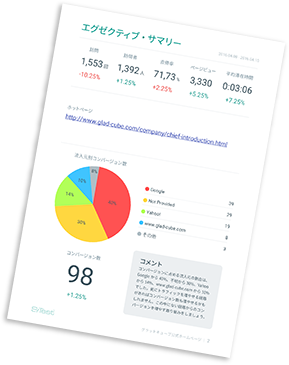
Data summary
Displays instrumented access statistics information. You can see quantitatively the information that tells you at what timing the inflow is increasing and which users are visiting frequently.
What the data summarizes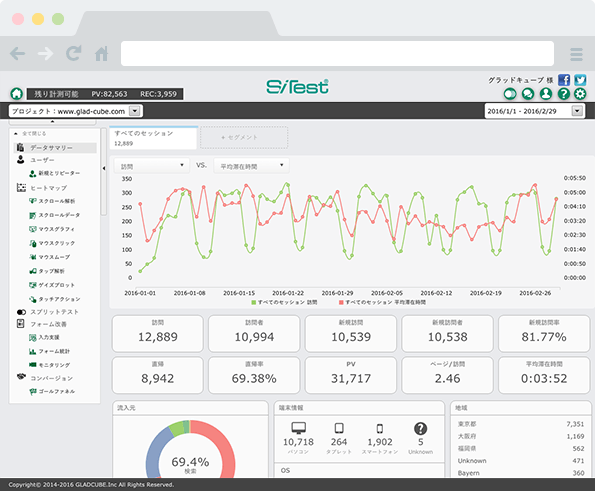
New and revisited
You can display daily data for new and returning visitors. By looking at the causal relationship between the data, you can investigate why the data is increasing or decreasing.
What you can identify with new and return visitors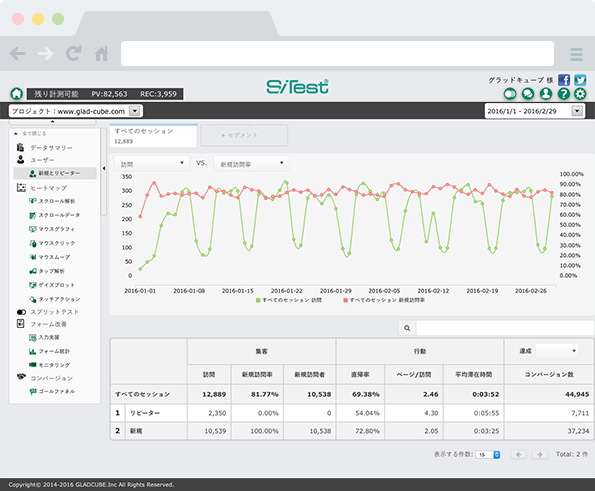
-
Contact Us
We support happily our professional
about the differences and compare
with the introduction examination
and third-party tool of SiTest. -
Consulting
Take advantage of the heat map,
those having problems with your improvement of implementation
and the form of the AB test,
our professionals we will consulting.
Please feel free to contact us right now.

